Debug gblic in Arch Linux
Our ability as programmers is limited by the tools we use. Tools are extensions of our bodies. They let us experience life in a new and different way.
In the programming of systems, a foundamental ability is to be able debug a process while it is executing. To develop this ability we must have the right toolset at our disposal.
In this blog post I want to show how to debug gblic, the GNU implementation of the standard C library, using debuginfod in order to obtain debug source files and symbols. This method works also for debugging other libraries, if they are supported by debuginfod. In general the setup is simple and effective.
Docker Environment#
To make this guide reproducible I will use a basic docker container with just a base image of archlinux and an example of C code to debug.
The C code is shown below, written in a file named lcg.c. It uses functions taken from glibc, the GNU implementation of the standard C library. These functions are printf, rand, srand, initstate and setstate.
#include <stdio.h>
#include <stdlib.h>

int main(void) {
  char state1[8];
  initstate(1337, state1, 0);
  setstate(state1);

  srand(42);
  int n = 10;
  for (int i = 0; i < n; i++) {
    printf("%d\n", rand());
  }

  return 0;
}
The Dockerfile is shown below. We copy the source code we want to debug, and then we install basic packages to build and debug the code.
FROM archlinux:latest

COPY lcg.c /lcg.c

RUN pacman -Syy --noconfirm
RUN pacman -S which make gcc gdb icu wget --noconfirm
We can build the docker image as follows
$ docker build -t glibc-debug .

Sending build context to Docker daemon  20.99kB
Step 1/4 : FROM archlinux:latest
 ---> bca64474746f
Step 2/4 : COPY lcg.c /lcg.c
 ---> 2ec044bb6730
Step 3/4 : RUN pacman -Syy --noconfirm
...
Removing intermediate container 727cc2933476
 ---> 0c9d057ee548
Successfully built 0c9d057ee548
Successfully tagged glibc-debug:latest
And then we can create the container with the following command.
$ docker run --name glibc-debug --rm -t -d glibc-debugTo spawn a shell within the docker you can execute the following command.
$ docker exec -it glibc-debug "/bin/sh"Once inside, the first thing we do is compile the binary with debugging symbols.
sh-5.2# cd /tmp
sh-5.2# ls
lcg.c
sh-5.2# gcc -ggdb lcg.c -o lcg
We can execute it as follows.
sh-5.2# ./lcg
71876166
708592740
1483128881
907283241
442951012
537146758
1366999021
1854614940
647800535
53523743Debuginfod#
The simplest method to retrive the debugging information is by using debuginfod, which is a service used for providing debug information over an HTTP API. For more information, as always, read the related archwiki page.
https://wiki.archlinux.org/title/Debuginfod
To use this functionality we need to export the environment variable called DEBUGINFOD_URLS so that it will be used by gdb. This can be done as follows.
export DEBUGINFOD_URLS="https://debuginfod.archlinux.org/"Once we have exported it, we can launch gdb with and start debugging. We put a breakpoint into rand and we send the run command to start execution. At this point the debugger will ask if we want to enable debuginfod for this session. We reply with y. Once we do that, it will proceed to download the source file on which we place the breakpoint, which in this case is glibc/stdlib/rand.c.
sh-5.2# gdb -q ./lcg
Reading symbols from ./lcg...
(gdb) b rand
Breakpoint 1 at 0x1080
(gdb) run
Starting program: /tmp/lcg
warning: Error disabling address space randomization: Operation not permitted

This GDB supports auto-downloading debuginfo from the following URLs:
  <https://debuginfod.archlinux.org/>
Enable debuginfod for this session? (y or [n]) y
Debuginfod has been enabled.
To make this setting permanent, add 'set debuginfod enabled on' to .gdbinit.
[Thread debugging using libthread_db enabled]                                                           Using host libthread_db library "/usr/lib/libthread_db.so.1".
Downloading source file /usr/src/debug/glibc/glibc/stdlib/rand.c
                                                                                                        Breakpoint 1, rand () at rand.c:26
26      {
At this point (or also at the beginning) we can execute tui enable to get the source code listing.
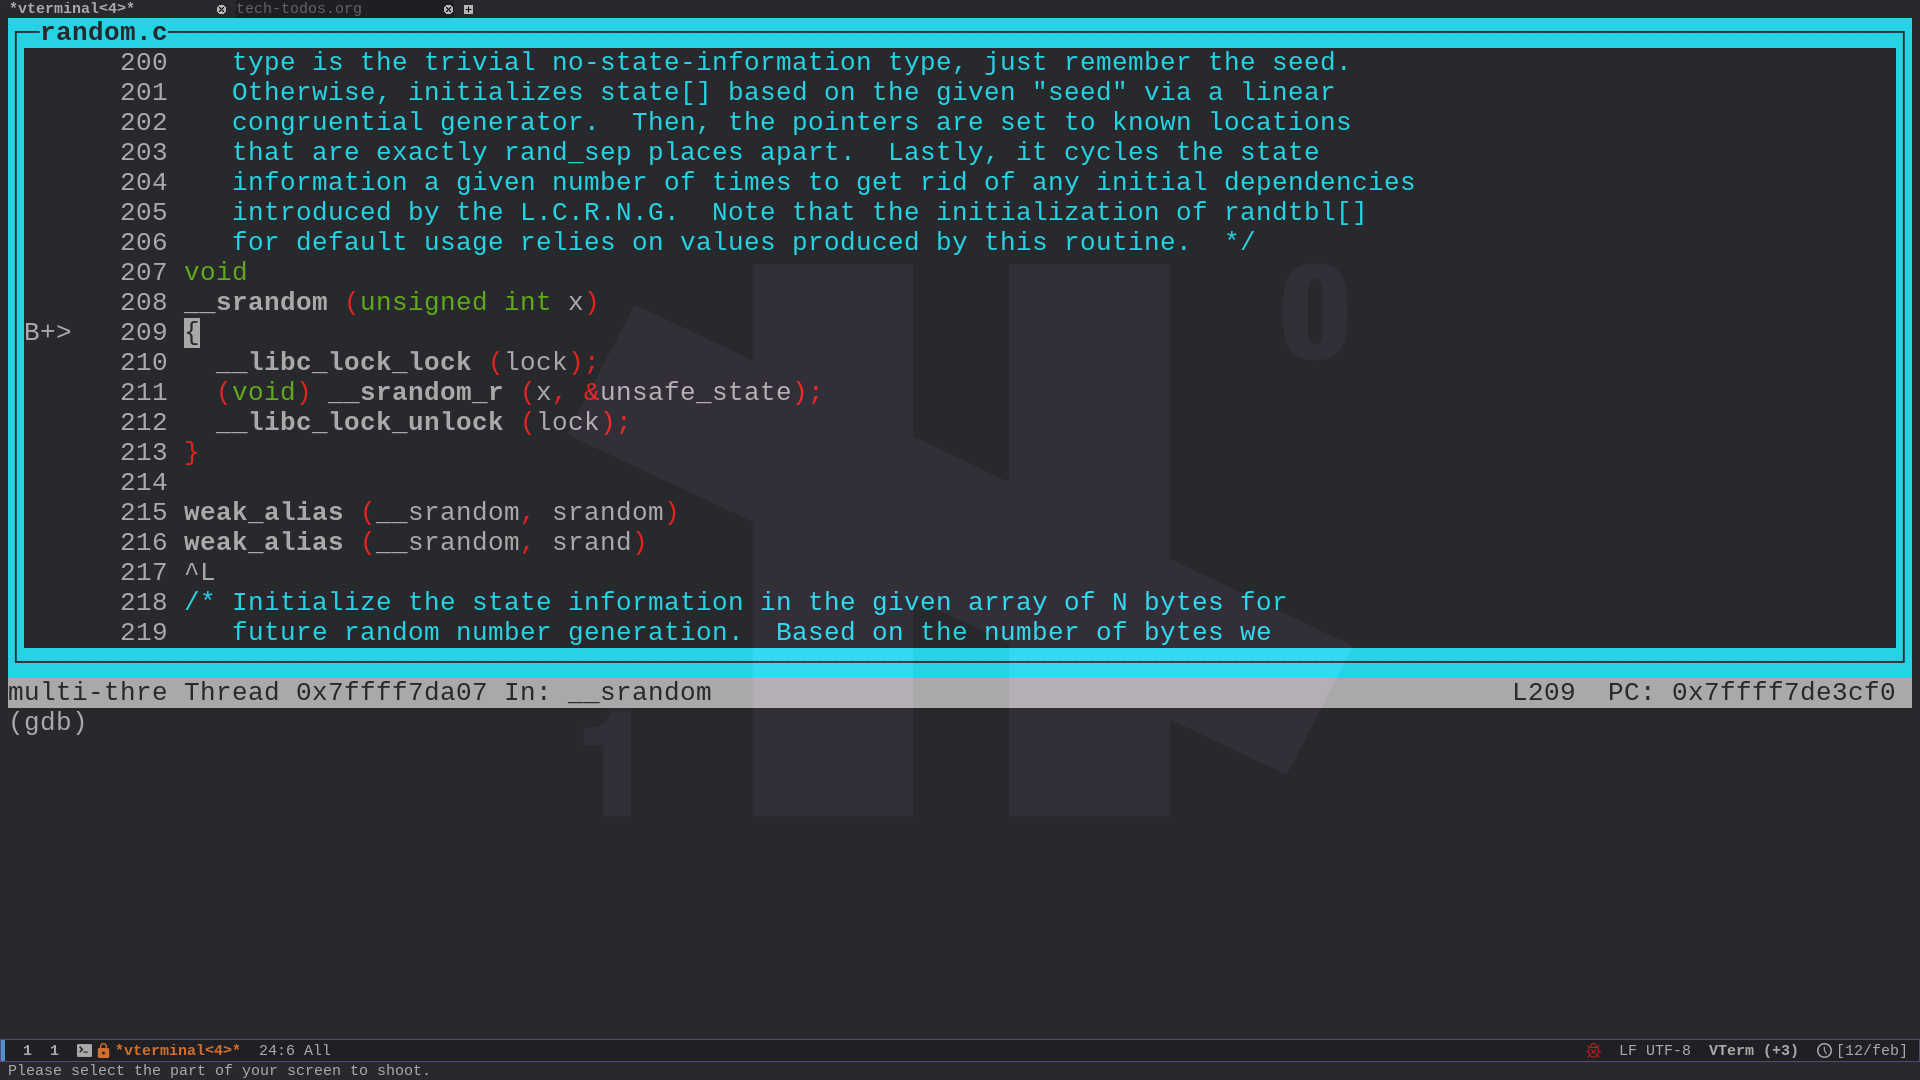
If you don't want to press y everytime, you can directly set within the .gdbinit config file the following line
set debuginfod enabled onDebugging with this new addition of debuginfod means that we do not have to do a full compile build just to get the debug symbols and source code.
That's it!
References#
To finish off, some references regarding the topics covered.
Related to debuginfod
- https://wiki.archlinux.org/title/Debuginfod
- https://debuginfod.archlinux.org/
- https://bugs.archlinux.org/task/73792
- https://www.phoronix.com/news/Arch-Linux-Debug-Packages
- https://sourceware.org/gdb/current/onlinedocs/gdb.html/Debuginfod-Settings.html
On glibc debugging in ubuntu
Others
- https://geo.mirror.pkgbuild.com/core-debug/os/x86_64/
- https://stackoverflow.com/questions/10000335/how-to-use-debug-version-of-libc
Method 1 – Pre-Compiled Libraries#
To fix this problem there are various ways.
The way it is working for me right now is to download a pre-compiled version of the glibc library with debug symbols enabled. This is the fastest way you can get debug symbols and source code on your system. Problem here is to find the right version of the pre-compiled library. You can find the 2.39 version at the following URL, just search for glibc-debug-2.39-1-x86_64.pkg.tar.zst.
https://geo.mirror.pkgbuild.com/core-debug/os/x86_64/
You can download the library with wget. Once download you can install in your system with pacman.
$ wget https://geo.mirror.pkgbuild.com/core-debug/os/x86_64/glibc-debug-2.39-1-x86_64.pkg.tar.zst
$ pacman -U glibc-debug-2.39-1-x86_64.pkg.tar.zst
At this point if you re-try what we did previously in order to see if now you have the glibc sources for debugging you will find that it still does not work. This is because we debug version we have installed is the 2.39-1 version, while the one we have in our system is different. To fix this you can simply update to the latest glibc.
$ pacman -S glibcAnd to check which version you have you can use ldd as follows.
$ ldd --version
ldd (GNU libc) 2.39
Copyright (C) 2024 Free Software Foundation, Inc.
This is free software; see the source for copying conditions.  There is NO
warranty; not even for MERCHANTABILITY or FITNESS FOR A PARTICULAR PURPOSE.
Written by Roland McGrath and Ulrich Drepper.
Now we're finally able to debug the srand function.
$ gdb -q ./lcg
(gdb) b srand
(gdb) tui enable
(gdb) run
And now we can see the source code of the glibc library!

NOTE 1: The solution just described only works for the latest version, the 2.39-1 version, and thus it is a limited solution. To have more flexibility one would need to learn how to compile a custom build of glibc with debug symbols enabled.
NOTE 2: Recently there is also the support for debuginfod, which is a service that provides debug information over an HTTP API, and it can be used by debugging tools such as gdb to quickly obtain the debug source files of the project we're debugging without needing to do full debug builds. While this service seems great, I've tried and it does not seem to work for glibc. If you know something about it please tell me!
Method 2 – Manual Compilation#
Clone from the ABS (Arch Build System).
git clone https://gitlab.archlinux.org/archlinux/packaging/packages/glibc.gitgit clone https://gitlab.archlinux.org/archlinux/packaging/packages/glibc-debug.gitRaw#
Start with a simple example in C and let's ask ouselves: what code is executed when we go inside srand and rand()?
#include <stdio.h>
#include <stdlib.h>

int main(void) {
  srand(1337);
  printf("%d\n", rand());
  printf("%d\n", rand());
  return 0;
}
Compile
gcc example_3_rand_lcg.c -o example_3_rand_lcgCheck libraries
ldd rand-lcg
        linux-vdso.so.1 (0x00007fffc87bd000)
        libc.so.6 => /usr/lib/libc.so.6 (0x00007fa9c393e000)
        /lib64/ld-linux-x86-64.so.2 => /usr/lib64/ld-linux-x86-64.so.2 (0x00007fa9c3b5d000)
Download and compile debug version of glibc. Make sure to download right version.
https://gitlab.archlinux.org/archlinux/packaging/packages/glibc

cd /tmp
git clone https://gitlab.archlinux.org/archlinux/packaging/packages/glibc

# Add current locale to locale.gen.txt
grep -v "#" /etc/locale.gen >> locale.gen.txt

# Enable debug build in PKGBUILD
sed -i 's#!strip#debug#' PKGBUILD

# Build glibc and glibc-debug packages
makepkg --skipchecksums

# Install glibc-debug
sudo pacman -U *.pkg.tar.xz
Once we have finished the compilation process, we can start to debug with GDB.
pacman -S wget
wget https://geo.mirror.pkgbuild.com/core-debug/os/x86_64/glibc-debug-2.39-1-x86_64.pkg.tar.zst
TODO...
So far the basic idea is:
- install gdb, gcc, make, icu, and other basic binaries
- enable debuginfod from gdb with env variable
- debuginfod does not work for libc, doesnt show debug symbols
- to get debug symbols either build a full version of the library with debug symsols or download a pre-built one from a mirror such as https://geo.mirror.pkgbuild.com/core-debug/os/x86_64/